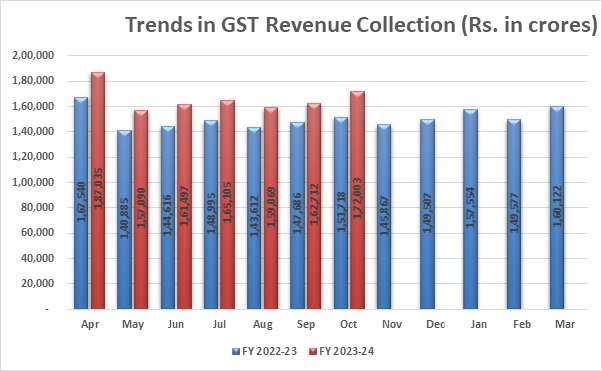
GST Collections in October 2023 Surge, Second-Highest Ever Recorded

India’s Goods and Services Tax (GST) revenue collection for October 2023 has reached a remarkable ₹1.72 lakh crore, marking the second-highest collection ever recorded, with April 2023 holding the top spot. This achievement reflects a notable year-on-year increase of 13%.
A detailed breakdown of the GST revenue collection for October 2023 is as follows:
- Central Goods and Services Tax (CGST): ₹30,062 crore
- State Goods and Services Tax (SGST): ₹38,171 crore
- Integrated Goods and Services Tax (IGST): ₹91,315 crore, including ₹42,127 crore collected on the import of goods
- Cess: ₹12,456 crore, including ₹1,294 crore collected on the import of goods
In this fiscal endeavor, the government has efficiently allocated ₹42,873 crore to CGST and ₹36,614 crore to SGST from IGST. After the customary settlement, the total revenue for the Center and the States for October 2023 stands at ₹72,934 crore for CGST and ₹74,785 crore for SGST.
The GST revenue for October 2023 has surged by 13% when compared to the same month the previous year. Additionally, revenue generated from domestic transactions, including the import of services, has also witnessed a commendable 13% year-on-year increase.
Overall, the average gross monthly GST collection for the fiscal year 2023-24 has now reached ₹1.66 lakh crore, demonstrating an 11% year-on-year growth.
These figures highlight a robust economic environment and promising growth prospects within the Indian market. For comprehensive insights, please refer to the accompanying state-wise post-settlement GST revenue table.
April-October (Rs. in crore)
| Pre-Settlement SGST | Post-Settlement SGST[1] | |||||
| State/UT | 2022-23 | 2023-24 | Growth | 2022-23 | 2023-24 | Growth |
| Jammu and Kashmir | 1,318 | 1,762 | 34% | 4,299 | 4,817 | 12% |
| Himachal Pradesh | 1,341 | 1,546 | 15% | 3,368 | 3,302 | -2% |
| Punjab | 4,457 | 4,903 | 10% | 11,378 | 13,115 | 15% |
| Chandigarh | 351 | 389 | 11% | 1,227 | 1,342 | 9% |
| Uttarakhand | 2,805 | 3,139 | 12% | 4,513 | 4,890 | 8% |
| Haryana | 10,657 | 11,637 | 9% | 18,291 | 20,358 | 11% |
| Delhi | 8,000 | 9,064 | 13% | 16,796 | 18,598 | 11% |
| Rajasthan | 8,832 | 9,859 | 12% | 19,922 | 22,571 | 13% |
| Uttar Pradesh | 15,848 | 18,880 | 19% | 38,731 | 42,482 | 10% |
| Bihar | 4,110 | 4,731 | 15% | 13,768 | 15,173 | 10% |
| Sikkim | 179 | 297 | 66% | 489 | 629 | 29% |
| Arunachal Pradesh | 282 | 378 | 34% | 932 | 1,155 | 24% |
| Nagaland | 125 | 177 | 42% | 564 | 619 | 10% |
| Manipur | 166 | 210 | 27% | 812 | 659 | -19% |
| Mizoram | 105 | 168 | 60% | 488 | 573 | 18% |
| Tripura | 242 | 299 | 23% | 847 | 928 | 9% |
| Meghalaya | 265 | 353 | 33% | 841 | 988 | 17% |
| Assam | 2,987 | 3,428 | 15% | 7,237 | 8,470 | 17% |
| West Bengal | 12,682 | 13,799 | 9% | 22,998 | 24,607 | 7% |
| Jharkhand | 4,329 | 5,152 | 19% | 6,466 | 7,128 | 10% |
| Odisha | 8,265 | 9,374 | 13% | 11,031 | 12,723 | 15% |
| Chhattisgarh | 4,285 | 4,773 | 11% | 6,421 | 7,656 | 19% |
| Madhya Pradesh | 6,062 | 7,384 | 22% | 15,418 | 18,100 | 17% |
| Gujarat | 21,644 | 24,005 | 11% | 32,943 | 36,322 | 10% |
| Dadra and Nagar Haveli and Daman and Diu | 381 | 372 | -3% | 709 | 606 | -15% |
| Maharashtra | 48,870 | 58,057 | 19% | 74,612 | 84,712 | 14% |
| Karnataka | 20,165 | 23,400 | 16% | 37,924 | 42,657 | 12% |
| Goa | 1,111 | 1,307 | 18% | 2,024 | 2,299 | 14% |
| Lakshadweep | 6 | 16 | 162% | 18 | 66 | 259% |
| Kerala | 7,016 | 8,082 | 15% | 17,450 | 18,370 | 5% |
| Tamil Nadu | 20,836 | 23,661 | 14% | 34,334 | 37,476 | 9% |
| Puducherry | 271 | 288 | 6% | 695 | 833 | 20% |
| Andaman and Nicobar Islands | 112 | 125 | 12% | 287 | 311 | 8% |
| Telangana | 9,538 | 11,377 | 19% | 21,301 | 23,478 | 10% |
| Andhra Pradesh | 7,347 | 8,128 | 11% | 16,441 | 18,488 | 12% |
| Ladakh | 81 | 121 | 49% | 311 | 377 | 21% |
| Other Territory | 97 | 140 | 44% | 281 | 685 | 144% |
| Grand Total | 2,35,167 | 2,70,777 | 15% | 4,46,167 | 4,97,562 | 12% |


